Your AI.Accounted for.

Several tools. Different subscriptions. One picture of what is left and where your AI work goes.

It reads the history your tools already keep, assigns it to projects, and measures it against the limits of the plans you pay for.

How much can you still do?

Example
Used
32%
68% left
Until reset
2d 7h
Weekly window
At reset
48%
at the current pace
Pace
0.48×
1× uses exactly the limit
now start reset
  • usage
  • current pace

At this pace about 52% stays unused at reset.

Sample data. Available windows vary by provider and plan.

Your tools, a shared history.

  • Codex
  • Claude Code
  • OpenCode
  • Grok
  • Gemini / Antigravity

Work from several computers lands in one shared archive, so every machine shows the same picture.

History, token counts and limit readings vary across integrations.

The subscription is just the start.

A monthly fee alone cannot tell you what you get from AI. tokenAtlas connects it to how you actually work.

Explore project costs
Screenshot of the tokenAtlas Overview: usage, time to reset and pace of the current window, with a chart forecasting when the limit will be reached.Screenshot of the tokenAtlas Overview: usage, time to reset and pace of the current window, with a chart forecasting when the limit will be reached.
Overview: the current window, how fast it is filling and when the limit is forecast to run out.

Capacity with context.

Check subscription usage, the next reset and past windows. See when you are approaching a limit and when capacity is going unused.
Every project has a cost.

Compare usage and costs across projects. Find out which models and accounts make up the largest share of your usage.

Is the subscription paying off?

Compare what you pay for a plan with the API value of the work it carried, and see how much of the capacity you bought went unused.

History you can return to.

Today, last week, a full cycle. See how your usage changes and return to recorded data without piecing together logs by hand.

What does each project really cost?

For every project you work on, tokenAtlas shows:

  1. Subscription vs API

    What your plans cost, and what the same work would cost at API prices.

  2. Time and traffic

    Active hours, calls and tokens, cache included.

  3. Week by week

    When the work happened, and which weeks cost the most.

  4. Which subscriptions carried it

    Each account's share, its cost and its API value.

  5. Which models did the work

    The models behind the project and their share of the tokens.

Example · tokenAtlas, real dataAug 21, 2026 – Oct 29, 2026
tokenAtlasAll time

How much did this project cost?

Cost from subscriptions
≥ $211.04
Known plan prices only
Value at API prices
$14,810.12
≤ 70× the subscription cost
Active time
≈ 750h
≈ 94 workdays of 8 h
Traffic
30.7B
140,285 calls · tokens incl. cache

How did it spread over time?

Usage history at API prices, per week
  • Claude A
  • Codex A
  • Codex B
  • Other subscriptions
$1,750$3,500Aug 17Aug 24Aug 31Sep 7Sep 14Sep 21Sep 28Oct 5Oct 12Oct 19Oct 26
Time spent on the project (≈), per week
16 h82 h45 h54 h84 h89 h110 h111 h69 h64 h26 hAug 17Aug 24Aug 31Sep 7Sep 14Sep 21Sep 28Oct 5Oct 12Oct 19Oct 26

Which subscriptions carried it?

Which subscriptions carried it?
SubscriptionSubscription costAPI valueAPI value ÷ cost
Claude A18.6B tokens≥ $69.46$8,231.76
≤ 119×
Codex A7.5B tokens$73.47$4,290.61
58×
Codex B4.2B tokens$44.73$2,035.74
46×
Other subscriptions476.4M tokens≥ $23.38$252.00
≤ 11×
tokenAtlasAll time

Which models did the work?

21models
ModelShareShare
claude-opus-5-545.3%
gpt-6.1-sol12.0%
gpt-6-astra9.8%
claude-opus-59.0%
gpt-5.6-sol6.6%
Other models (16)17.4%

Share of the project's tokens, cache included, all time.

Subscription cost: dated plan prices, split by the API value of each subscription's work; ≥ marks plans without a recorded price. API value: the same calls at public API rates, cached tokens included. Accounts are shown as letters. Data exported:

What does a month of the plan really give?

A weekly percentage says little on its own. tokenAtlas prices every window at API rates and adds up the billing month: the weeks you pay for, plus the windows resets added.

  1. A month of the plan

    How many full windows and how much API value one billing month delivered, resets included.

  2. Resets, counted honestly

    Granted resets you choose when to use count in full. Random automatic ones are shown apart: they arrive unannounced, often with the window half used.

Subscription
UnitAPI $ Resets counted PeriodPrevious month

Billing month: capacity vs usage

16.09 – 16.10
Total capacity
$12,621
Per reset
$1,392
one window · 9.1 windows
Used
$8,526
Utilisation
68%
Paid
$200.00
Return
43×
Potential
63×

Without early resets $7,662automatic +$3,109banked +$982other +$868

Capacity of each billing month · API $

Codex A
MonthPlanPaidCapacityUsedUsed %ReturnPotential
21.10–21.11 ongoingPro ×20$208.68≈$8,485$4,416≈52%21×≈41×
16.10–21.10Pro ×20$36.96$2,477$1,44458%39×67×
16.09–16.10Pro ×20$200.00$12,621$8,52668%43×63×
16.08–16.09Pro ×20$217.96$21,457$16,75178%77×98×
10.07–10.08Pro ×20$134.25$31,452$19,05561%142×234×
06.07–10.07Pro ×5$76.71$1,056$62859%8.2×14×
02.07–06.07Plus ×1$21.35$124$7258%3.4×5.8×
04.06–16.06Pro ×5$0.00$1,072$85380%——
04.05–04.06Pro ×5$97.89$6,894$5,32677%54×70×
27.04–04.05Plus ×1$4.77$175$12873%27×37×

≈ ongoing month: an estimate for the whole month, the windows to date plus the scheduled windows to its end, without future resets.

Sample data. Values are API equivalents, not charges. The value of 1% moves with the models and caching each window used.

What does a week give you, from reset to reset?

tokenAtlas prices each full window at API rates and scales it to 100%, so weeks of different plans and periods line up:

  1. A full week at 100%

    The capacity of each window from reset to reset, scaled to 100%, as one segment per cycle.

  2. The levels it went through

    Marked moments show the levels a full week went through, from its highest to today.

  3. Every cycle on one row

    Each cycle with its dates and its value at 100%, no extra columns.

  4. What changed, and when

    The provider's announcements and global resets, dated between the cycles as in the app.

  5. See what came next

    History entries share one timeline with the cycles, so next to an event you see what capacity did afterwards. For example: 09-29 · Pro $200: 20× → 10× usage announced, and from 10-03 a full week went from $1,425 to $1,116 (−22%).

Example · real cycles of one plan

Capacity at 100% in successive cycles · API $

Codex A · Pro ×20 · last 180 days
$500$1,000$1,500$2,000$2,500$3,000$3,50006-0107-0108-0109-0110-01≥ $2,078≥ $2,794≥ $2,015≥ $1,425≥ $1,116
  1. 07-11 – 08-07 ≥ $2,078 10 weeks
  2. 08-08 – 08-21 ≥ $2,794 4 weeks
  3. 08-23 – 09-04 ≥ $2,015 6 weeks
  4. 09-07 – 10-01 ≥ $1,425 8 weeks
  5. 10-03 – 10-28 ≥ $1,116 11 weeks

Cycles

Click a cycle to move the dashed line.
Cycle · UTCPlanCapacity at 100%
10/28, 07:39→ 10/29, 16:16
Pro ×20
≥ $1,169
10/26, 06:08→ 10/28, 00:17
Pro ×20
≥ $1,197
10/25, 10:28→ 10/26, 06:04
Pro ×20
≥ $1,281
10/23, 22:10→ 10/25, 03:15
Pro ×20
≥ $1,282
10/22, 17:11→ 10/23, 17:38
Pro ×20
≥ $1,187
10-21Cache: 12h in API, indefinite in signed-in Codex / Work
10-20Global reset
10/20, 06:32→ 10/22, 17:08
Pro ×20
≥ $1,085
10-17Global reset
10/17, 20:40→ 10/20, 06:27
Pro ×20
≥ $1,053
10-16Context reuse and cache: more effective usage announced
10-15Global reset
10/15, 06:19→ 10/17, 20:39
Pro ×20
≥ $1,080
10/14, 10:26→ 10/15, 06:09
Pro ×20
≥ $1,212
10-13Global reset
10/13, 04:58→ 10/14, 02:53
Pro ×20
≥ $1,298
10/11, 05:25→ 10/13, 04:58
Pro ×20
≥ $1,080
10-11Global reset
10/07, 06:19→ 10/11, 03:56
Pro ×20
≥ $1,116
10-07Global reset
10/03, 09:22→ 10/07, 03:27
Pro ×20
≥ $1,108
10-02Global reset
09-29Pro $200: 20× → 10× usage announced
09-26Global reset
09/26, 16:58→ 10/01, 09:15
Pro ×20
≥ $1,561
09/25, 08:00→ 09/26, 16:55
Pro ×20
≥ $1,456
09/17, 21:56→ 09/19, 18:14
Pro ×20
≥ $1,394
09/15, 06:42→ 09/17, 21:48
Pro ×20
≥ $1,159
09/12, 09:48→ 09/14, 21:56
Pro ×20
≥ $1,372
09/12, 08:10→ 09/12, 08:12
Pro ×20
≥ $82
09-12Global reset
09-09Plan change · Plus ×1 → Pro ×20
09/08, 21:06→ 09/12, 08:08
Pro ×20
≥ $1,465
09-08Global reset
09/08, 01:21→ 09/08, 20:07
Pro ×20
≥ $1,458
09/07, 08:06→ 09/08, 01:21
Pro ×20
≥ $1,205
08/31, 06:09→ 09/04, 20:58
Pro ×20
≥ $2,012
08-31Global reset
08/29, 22:42→ 08/31, 00:57
Pro ×20
≥ $1,982
08-27Global reset
08/27, 16:24→ 08/29, 16:58
Pro ×20
≥ $2,018
08-25Global reset
08/25, 14:14→ 08/27, 16:24
Pro ×20
≥ $2,022
08-24Global reset
08/24, 00:43→ 08/25, 14:13
Pro ×20
≥ $1,960
08/23, 15:50→ 08/24, 00:33
Pro ×20
≥ $2,170
08/16, 15:37→ 08/21, 12:59
Pro ×20
≥ $2,685
08/13, 03:33→ 08/16, 04:24
Pro ×20
≥ $2,826
08-11Global reset
08/10, 23:59→ 08/13, 03:31
Pro ×20
≥ $2,904
08/08, 20:32→ 08/10, 23:57
Pro ×20
≥ $2,762
08-08Global reset
08/08, 07:00→ 08/08, 20:32
Pro ×20
≥ $2,623
08/01, 06:46→ 08/07, 06:31
Pro ×20
≥ $2,535
08-01Global reset
07/29, 06:09→ 07/31, 08:50
Pro ×20
≥ $2,316
07-29Global reset
07/28, 05:21→ 07/29, 03:19
Pro ×20
≥ $2,005
07-28Global reset
07/25, 19:18→ 07/28, 00:57
Pro ×20
≥ $1,910
07-25Global reset
07/21, 17:27→ 07/25, 19:13
Pro ×20
≥ $2,097
07/21, 10:07→ 07/21, 14:42
Pro ×20
≥ $1,742
07-18Global reset
07/18, 03:25→ 07/21, 10:03
Pro ×20
≥ $2,197
07/17, 21:58→ 07/18, 03:18
Pro ×20
≥ $1,401
07/16, 06:05→ 07/17, 21:58
Pro ×20
≥ $2,005
07/14, 21:08→ 07/15, 22:50
Pro ×20
≈ $2,208
07/12, 18:58→ 07/14, 18:50
Pro ×20
≈ $2,205
07-12Five-hour limit temporarily lifted
07/11, 06:04→ 07/12, 18:57
Pro ×20
≥ $2,060
07-11Plan change · Pro ×5 → Pro ×20
07-10Global reset
07/10, 17:27→ 07/11, 05:40
plan not established
≥ $2,106
07/09, 22:53→ 07/10, 17:25
Pro ×5
≥ $502
07/06, 09:25→ 07/09, 21:08
Pro ×5
≥ $556
07-06Plan change · Plus ×1 → Pro ×5
07/02, 08:12→ 07/06, 09:12
Plus ×1
≥ $115
07-02Plan change · Pro ×5 → Plus ×1
06-28Global reset
06-18Global reset
06/11, 10:14→ 06/16, 06:43
Pro ×5
≥ $553
06/04, 06:35→ 06/09, 18:43
Pro ×5
≈ $546
06-04Global reset
06-01Pro $100: 10× Plus usage instead of 5×
05/31, 16:00→ 06/03, 21:46
Pro ×5
≈ $612
05-31Global reset
05/31, 09:51→ 05/31, 10:10
Pro ×5promo 2×
—
05/23, 21:06→ 05/30, 12:46
Pro ×5promo 2×
≈ $1,178
05-23Global reset
05/19, 18:39→ 05/23, 17:11
Pro ×5promo 2×
≈ $1,184
05/16, 21:12→ 05/19, 18:29
Pro ×5promo 2×
≥ $1,168
05-16Global reset
05/12, 06:43→ 05/16, 17:59
Pro ×5promo 2×
≥ $1,177
05/05, 06:43→ 05/12, 06:42
Pro ×5promo 2×
≈ $1,247
05-05Plan change · Plus ×1 → Pro ×5
05/02, 07:21→ 05/04, 17:41
Plus ×1
≈ $129

Real cycles, anonymised. Values are API equivalents scaled to 100% of the window, not charges.

Codex or Claude: which plan carries more?

Attach measured windows to each plan and compare them tier by tier: the median full week at API rates, and what each dollar of the subscription buys.

  1. Tier by tier

    Codex and Claude plans side by side at ×1, ×5 and ×20.

  2. A full week at API rates

    The median value of each plan's full weekly window over the history you choose.

  3. What a dollar buys

    API value per dollar of the subscription, so different prices compare fairly.

  4. A longer look back

    Switch between 30, 90 and 360 days; a plan without windows in that period stays empty and says when it was last measured.

Real comparison

Capacity battle

Codex and Claude plans tier by tier · each plan shows its cycles from the chosen history

HistoryCounterWeeklyCapacity basisObserved capacityUnitAPI $
TierCodexClaudeLead · API $
×1
Plus ×1$20 / mo
$8618.7× per $1
median of 31 cycles
Pro ×1$20 / mo
$640.5139.25× per $1
median of 4 cycles
lower bounds · no winner
×5
Pro ×5$100 / mo
$55324.05× per $1
median of 5 cycles
Max ×5$100 / mo
$40617.65× per $1
1 cycle
Codex +36%
×20
Pro ×20$200 / mo
$139530.33× per $1
median of 60 cycles
Max ×20$200 / mo
$253655.14× per $1
median of 6 cycles
lower bounds · no winner

Sample data, not a benchmark of either provider. In the app you attach windows from your own accounts; a plan without them stays empty, or is derived from another tier only when you ask.

Is this week normal?

tokenAtlas sets the current window beside the latest closed windows of the same plan, at the same moment of their course:

  1. This window

    Usage since the window started, up to now.

  2. The latest windows

    The four newest closed windows of the same plan, drawn alongside.

  3. Typical course and forecast

    Where a usual window would be by now, and where this one is heading.

  4. At the same moment

    A table that sets every window side by side at the same point of its course.

Example · real weekly window
Compare · Claude B · Max ×20
  • This window
  • The latest windows
  • Typical course and forecast
Usage since window start · the same plan (Max ×20) and cadence
0%50%100%01d2d3d4d5d6d7dnow10-24 · 14%10-08 · 100%10-18 · 100%10-11 · 97%now 47%

○ = end of the window. Grey = another plan, left out of the typical course. ┅ = forecast of the current window.

Building history: 1/2 closed windows with the same plan and cadence.

At the same moment
windowusage after
● end · ┃ now 47%
thenendΔ to now
current 2026-10-25T11:00:00.000Z
47%——
10-18
no coverage100%—
10-24 other plan · Pro ×1
no coverage14%—
10-11
86%97%−39.0 pp
10-08 other cadence
31%100%+16.1 pp

Sample data. Point at any moment of the window to compare it.

How fast do your models really answer?

tokenAtlas times every response it can and turns it into output tokens per second, model by model:

  1. Every model on one scale

    Output tokens per second, day by day, for each model you used.

  2. Long answers only

    Speed is read from long responses, where the wait for the first token no longer hides the real pace.

  3. Against the promise

    A provider's declared speed and the day it was announced, on the same chart.

  4. Before and after

    Seven days before the announcement against seven days after, with the change in percent.

Example · public speed measurements
Speed
gpt-6.1-solgpt-6-lunagpt-6-astragpt-6-sol

Long answers · output tokens per second, per day

0204060801001202026-09-0808.092026-09-1010.092026-09-1212.092026-09-1414.092026-09-1616.092026-09-1818.092026-09-2020.092026-09-2222.092026-09-2424.092026-09-2626.092026-09-2828.092026-09-3030.092026-10-0202.102026-10-0404.102026-10-0606.102026-10-0808.102026-10-1010.102026-10-1212.102026-10-1414.102026-10-1616.102026-10-1818.102026-10-2020.102026-10-2222.102026-10-2424.102026-10-2626.102026-10-2828.102026-10-2929.1050 tok/s05.10gpt-6.1-sol 2026-09-30 16.4 tok/s 847 long calls · measured 94%gpt-6.1-sol 2026-10-01 19.4 tok/s 5,265 long calls · measured 92%gpt-6.1-sol 2026-10-02 21.4 tok/s 9,539 long calls · measured 95%gpt-6.1-sol 2026-10-03 19.3 tok/s 6,172 long calls · measured 96%gpt-6.1-sol 2026-10-04 20.7 tok/s 3,002 long calls · measured 95%gpt-6.1-sol 2026-10-05 23.3 tok/s 2,200 long calls · measured 94%gpt-6.1-sol 2026-10-06 28.5 tok/s 2,928 long calls · measured 95%gpt-6.1-sol 2026-10-07 26.1 tok/s 2,053 long calls · measured 96%gpt-6.1-sol 2026-10-08 25.2 tok/s 2,417 long calls · measured 95%gpt-6.1-sol 2026-10-09 25.6 tok/s 3,604 long calls · measured 94%gpt-6.1-sol 2026-10-10 31.2 tok/s 5,999 long calls · measured 96%gpt-6.1-sol 2026-10-11 33.6 tok/s 4,062 long calls · measured 96%gpt-6.1-sol 2026-10-12 28.2 tok/s 4,217 long calls · measured 94%gpt-6.1-sol 2026-10-13 28.2 tok/s 2,040 long calls · measured 95%gpt-6.1-sol 2026-10-14 26.9 tok/s 3,140 long calls · measured 92%gpt-6.1-sol 2026-10-15 37.0 tok/s 3,894 long calls · measured 95%gpt-6.1-sol 2026-10-16 37.2 tok/s 2,618 long calls · measured 95%gpt-6.1-sol 2026-10-17 49.1 tok/s 4,735 long calls · measured 96%gpt-6.1-sol 2026-10-18 40.8 tok/s 7,189 long calls · measured 97%gpt-6.1-sol 2026-10-19 40.5 tok/s 4,871 long calls · measured 97%gpt-6.1-sol 2026-10-20 44.6 tok/s 2,276 long calls · measured 98%gpt-6.1-sol 2026-10-21 39.6 tok/s 4,348 long calls · measured 96%gpt-6.1-sol 2026-10-22 35.4 tok/s 6,652 long calls · measured 93%gpt-6.1-sol 2026-10-23 33.2 tok/s 5,708 long calls · measured 93%gpt-6.1-sol 2026-10-24 30.8 tok/s 2,121 long calls · measured 97%gpt-6.1-sol 2026-10-25 41.2 tok/s 857 long calls · measured 100%gpt-6.1-sol 2026-10-26 30.8 tok/s 2,644 long calls · measured 98%gpt-6.1-sol 2026-10-27 33.2 tok/s 5,729 long calls · measured 99%gpt-6.1-sol 2026-10-28 34.7 tok/s 4,282 long calls · measured 99%gpt-6.1-sol 2026-10-29 30.1 tok/s 2,759 long calls · measured 99%gpt-6-luna 2026-09-23 47.9 tok/s 11 long calls · measured 100%gpt-6-luna 2026-09-24 47.1 tok/s 604 long calls · measured 97%gpt-6-luna 2026-09-25 43.5 tok/s 53 long calls · measured 100%gpt-6-luna 2026-09-26 52.5 tok/s 29 long calls · measured 100%gpt-6-luna 2026-09-27 46.5 tok/s 279 long calls · measured 100%gpt-6-luna 2026-09-28 48.3 tok/s 191 long calls · measured 98%gpt-6-luna 2026-09-29 44.0 tok/s 35 long calls · measured 87%gpt-6-luna 2026-09-30 42.8 tok/s 41 long calls · measured 100%gpt-6-luna 2026-10-01 43.1 tok/s 30 long calls · measured 92%gpt-6-luna 2026-10-02 43.0 tok/s 765 long calls · measured 94%gpt-6-luna 2026-10-03 36.6 tok/s 87 long calls · measured 99%gpt-6-luna 2026-10-04 47.9 tok/s 322 long calls · measured 98%gpt-6-luna 2026-10-05 45.7 tok/s 523 long calls · measured 94%gpt-6-luna 2026-10-06 58.8 tok/s 734 long calls · measured 95%gpt-6-luna 2026-10-07 72.2 tok/s 161 long calls · measured 96%gpt-6-luna 2026-10-08 102.0 tok/s 445 long calls · measured 97%gpt-6-luna 2026-10-09 83.7 tok/s 3,021 long calls · measured 97%gpt-6-luna 2026-10-10 106.9 tok/s 179 long calls · measured 95%gpt-6-luna 2026-10-11 80.9 tok/s 85 long calls · measured 96%gpt-6-luna 2026-10-12 81.8 tok/s 507 long calls · measured 97%gpt-6-luna 2026-10-13 78.6 tok/s 357 long calls · measured 94%gpt-6-luna 2026-10-14 93.7 tok/s 684 long calls · measured 97%gpt-6-luna 2026-10-15 84.9 tok/s 1,071 long calls · measured 96%gpt-6-luna 2026-10-16 59.6 tok/s 436 long calls · measured 98%gpt-6-luna 2026-10-17 98.1 tok/s 1,029 long calls · measured 96%gpt-6-luna 2026-10-18 108.9 tok/s 790 long calls · measured 97%gpt-6-luna 2026-10-19 71.3 tok/s 277 long calls · measured 97%gpt-6-luna 2026-10-20 106.1 tok/s 286 long calls · measured 96%gpt-6-luna 2026-10-21 94.2 tok/s 505 long calls · measured 96%gpt-6-luna 2026-10-22 110.7 tok/s 1,774 long calls · measured 97%gpt-6-luna 2026-10-23 95.8 tok/s 759 long calls · measured 97%gpt-6-luna 2026-10-24 75.8 tok/s 303 long calls · measured 100%gpt-6-luna 2026-10-25 107.4 tok/s 54 long calls · measured 100%gpt-6-luna 2026-10-26 93.3 tok/s 752 long calls · measured 99%gpt-6-luna 2026-10-27 104.7 tok/s 251 long calls · measured 99%gpt-6-luna 2026-10-28 113.4 tok/s 98 long calls · measured 100%gpt-6-astra 2026-09-08 28.1 tok/s 33 long calls · measured 99%gpt-6-astra 2026-09-09 28.2 tok/s 34 long calls · measured 100%gpt-6-astra 2026-09-10 27.3 tok/s 440 long calls · measured 98%gpt-6-astra 2026-09-11 28.5 tok/s 827 long calls · measured 98%gpt-6-astra 2026-09-12 28.5 tok/s 2,058 long calls · measured 97%gpt-6-astra 2026-09-13 23.4 tok/s 998 long calls · measured 99%gpt-6-astra 2026-09-14 31.3 tok/s 19 long calls · measured 100%gpt-6-astra 2026-09-15 25.9 tok/s 662 long calls · measured 97%gpt-6-astra 2026-09-16 28.0 tok/s 624 long calls · measured 95%gpt-6-astra 2026-09-20 28.4 tok/s 105 long calls · measured 97%gpt-6-astra 2026-09-21 28.1 tok/s 474 long calls · measured 98%gpt-6-astra 2026-09-22 27.2 tok/s 1,090 long calls · measured 96%gpt-6-astra 2026-09-23 27.4 tok/s 217 long calls · measured 95%gpt-6-astra 2026-09-24 27.7 tok/s 814 long calls · measured 92%gpt-6-astra 2026-09-25 27.4 tok/s 168 long calls · measured 82%gpt-6-astra 2026-09-26 30.6 tok/s 98 long calls · measured 100%gpt-6-astra 2026-09-27 26.8 tok/s 48 long calls · measured 99%gpt-6-astra 2026-09-28 29.4 tok/s 327 long calls · measured 95%gpt-6-astra 2026-09-29 28.0 tok/s 1,279 long calls · measured 93%gpt-6-astra 2026-09-30 28.5 tok/s 8 long calls · measured 100%gpt-6-astra 2026-10-01 27.5 tok/s 8 long calls · measured 100%gpt-6-astra 2026-10-02 22.3 tok/s 270 long calls · measured 87%gpt-6-astra 2026-10-03 27.9 tok/s 33 long calls · measured 99%gpt-6-astra 2026-10-05 29.9 tok/s 6 long calls · measured 100%gpt-6-astra 2026-10-06 26.3 tok/s 6 long calls · measured 100%gpt-6-astra 2026-10-10 47.6 tok/s 29 long calls · measured 98%gpt-6-astra 2026-10-12 34.8 tok/s 105 long calls · measured 99%gpt-6-astra 2026-10-13 21.5 tok/s 1,630 long calls · measured 93%gpt-6-astra 2026-10-14 27.6 tok/s 15 long calls · measured 100%gpt-6-astra 2026-10-15 36.9 tok/s 103 long calls · measured 98%gpt-6-astra 2026-10-17 36.5 tok/s 12 long calls · measured 100%gpt-6-astra 2026-10-18 39.5 tok/s 55 long calls · measured 99%gpt-6-astra 2026-10-22 24.0 tok/s 1,141 long calls · measured 92%gpt-6-astra 2026-10-24 11.9 tok/s 405 long calls · measured 97%gpt-6-astra 2026-10-25 20.2 tok/s 2,226 long calls · measured 95%gpt-6-astra 2026-10-26 15.2 tok/s 1,704 long calls · measured 94%gpt-6-astra 2026-10-27 24.3 tok/s 535 long calls · measured 100%gpt-6-astra 2026-10-28 23.3 tok/s 378 long calls · measured 100%gpt-6-astra 2026-10-29 23.0 tok/s 364 long calls · measured 99%gpt-6-sol 2026-09-25 35.9 tok/s 932 long calls · measured 100%gpt-6-sol 2026-09-26 41.8 tok/s 3,159 long calls · measured 100%gpt-6-sol 2026-09-27 38.4 tok/s 1,461 long calls · measured 99%gpt-6-sol 2026-09-28 28.1 tok/s 1,925 long calls · measured 99%gpt-6-sol 2026-09-29 38.3 tok/s 2,093 long calls · measured 98%gpt-6-sol 2026-09-30 19.2 tok/s 109 long calls · measured 96%gpt-6-sol 2026-10-01 40.4 tok/s 559 long calls · measured 96%gpt-6-sol 2026-10-03 37.3 tok/s 62 long calls · measured 98%gpt-6-sol 2026-10-04 30.6 tok/s 1,395 long calls · measured 99%gpt-6-sol 2026-10-07 40.8 tok/s 337 long calls · measured 98%gpt-6-sol 2026-10-08 62.1 tok/s 863 long calls · measured 99%gpt-6-sol 2026-10-09 83.4 tok/s 79 long calls · measured 97%gpt-6-sol 2026-10-12 64.1 tok/s 322 long calls · measured 98%gpt-6-sol 2026-10-13 65.9 tok/s 187 long calls · measured 99%tok/s
  • Declared speed · 50 tok/s
  • Announcement · 2026-10-05
Model7 days before7 days afterChange
gpt-6.1-sol19.627.4+40%
gpt-6-luna44.679.0+77%
gpt-6-astra26.736.1+35%
gpt-6-sol31.264.3+106%

Public measurements from the author's accounts, as of 2026-10-29.

Many views of the same history.

tokenAtlas indexes everything your AI tools have already done into one local store. Each screen asks it a different question.

  1. Overview

    How much of the limit is gone against how much of the cycle is gone, and what that implies.

  2. History

    Every window as a bar and a table row: how it ended, how long it ran and which model led.

  3. Speed

    Output tokens per second for each model, from sending the request to the end of the response.

Real screens from the app, running on the author's own history. Account names are hidden by the app's privacy mode.
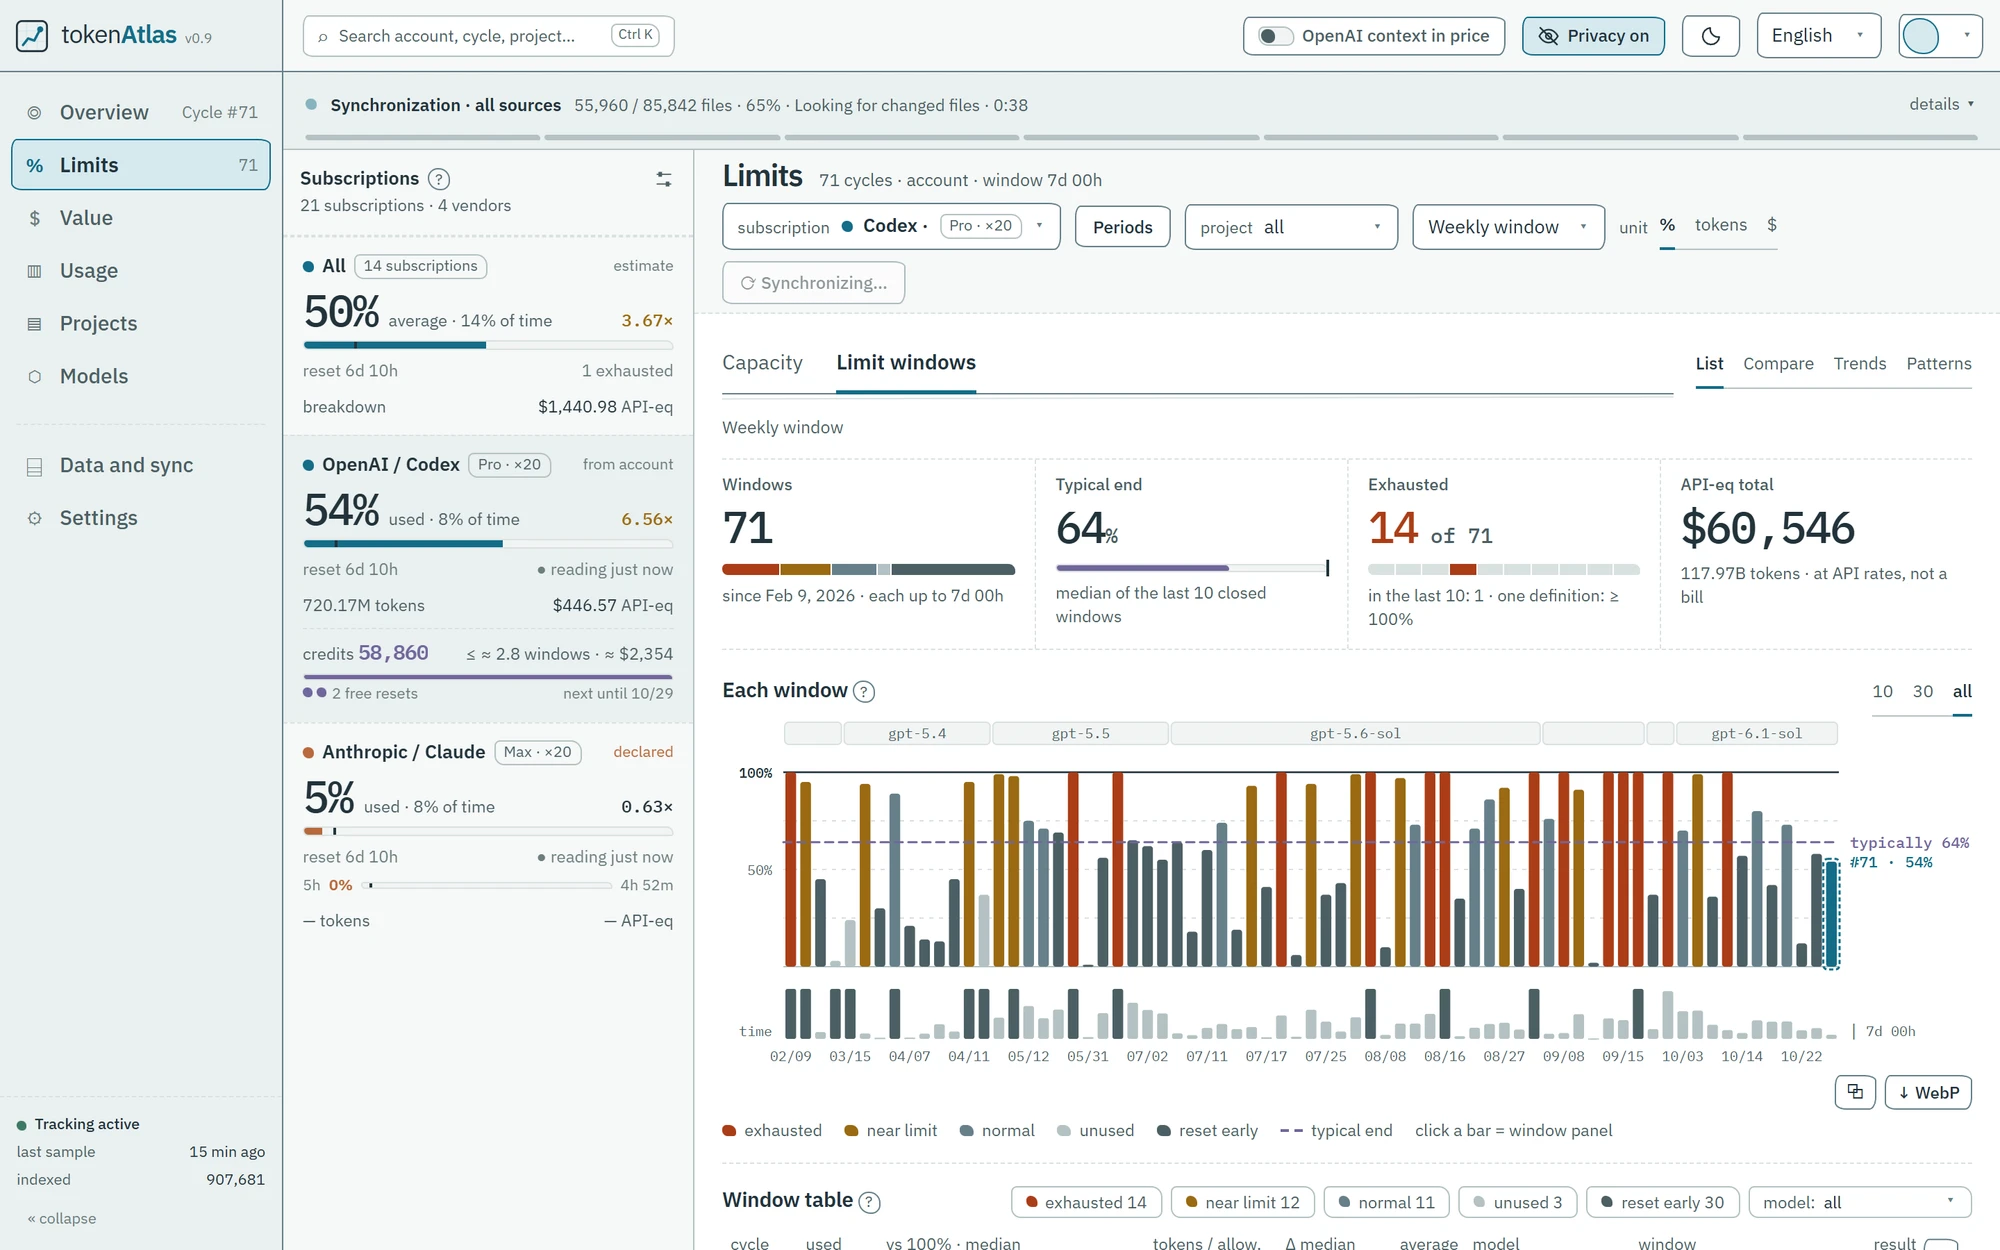
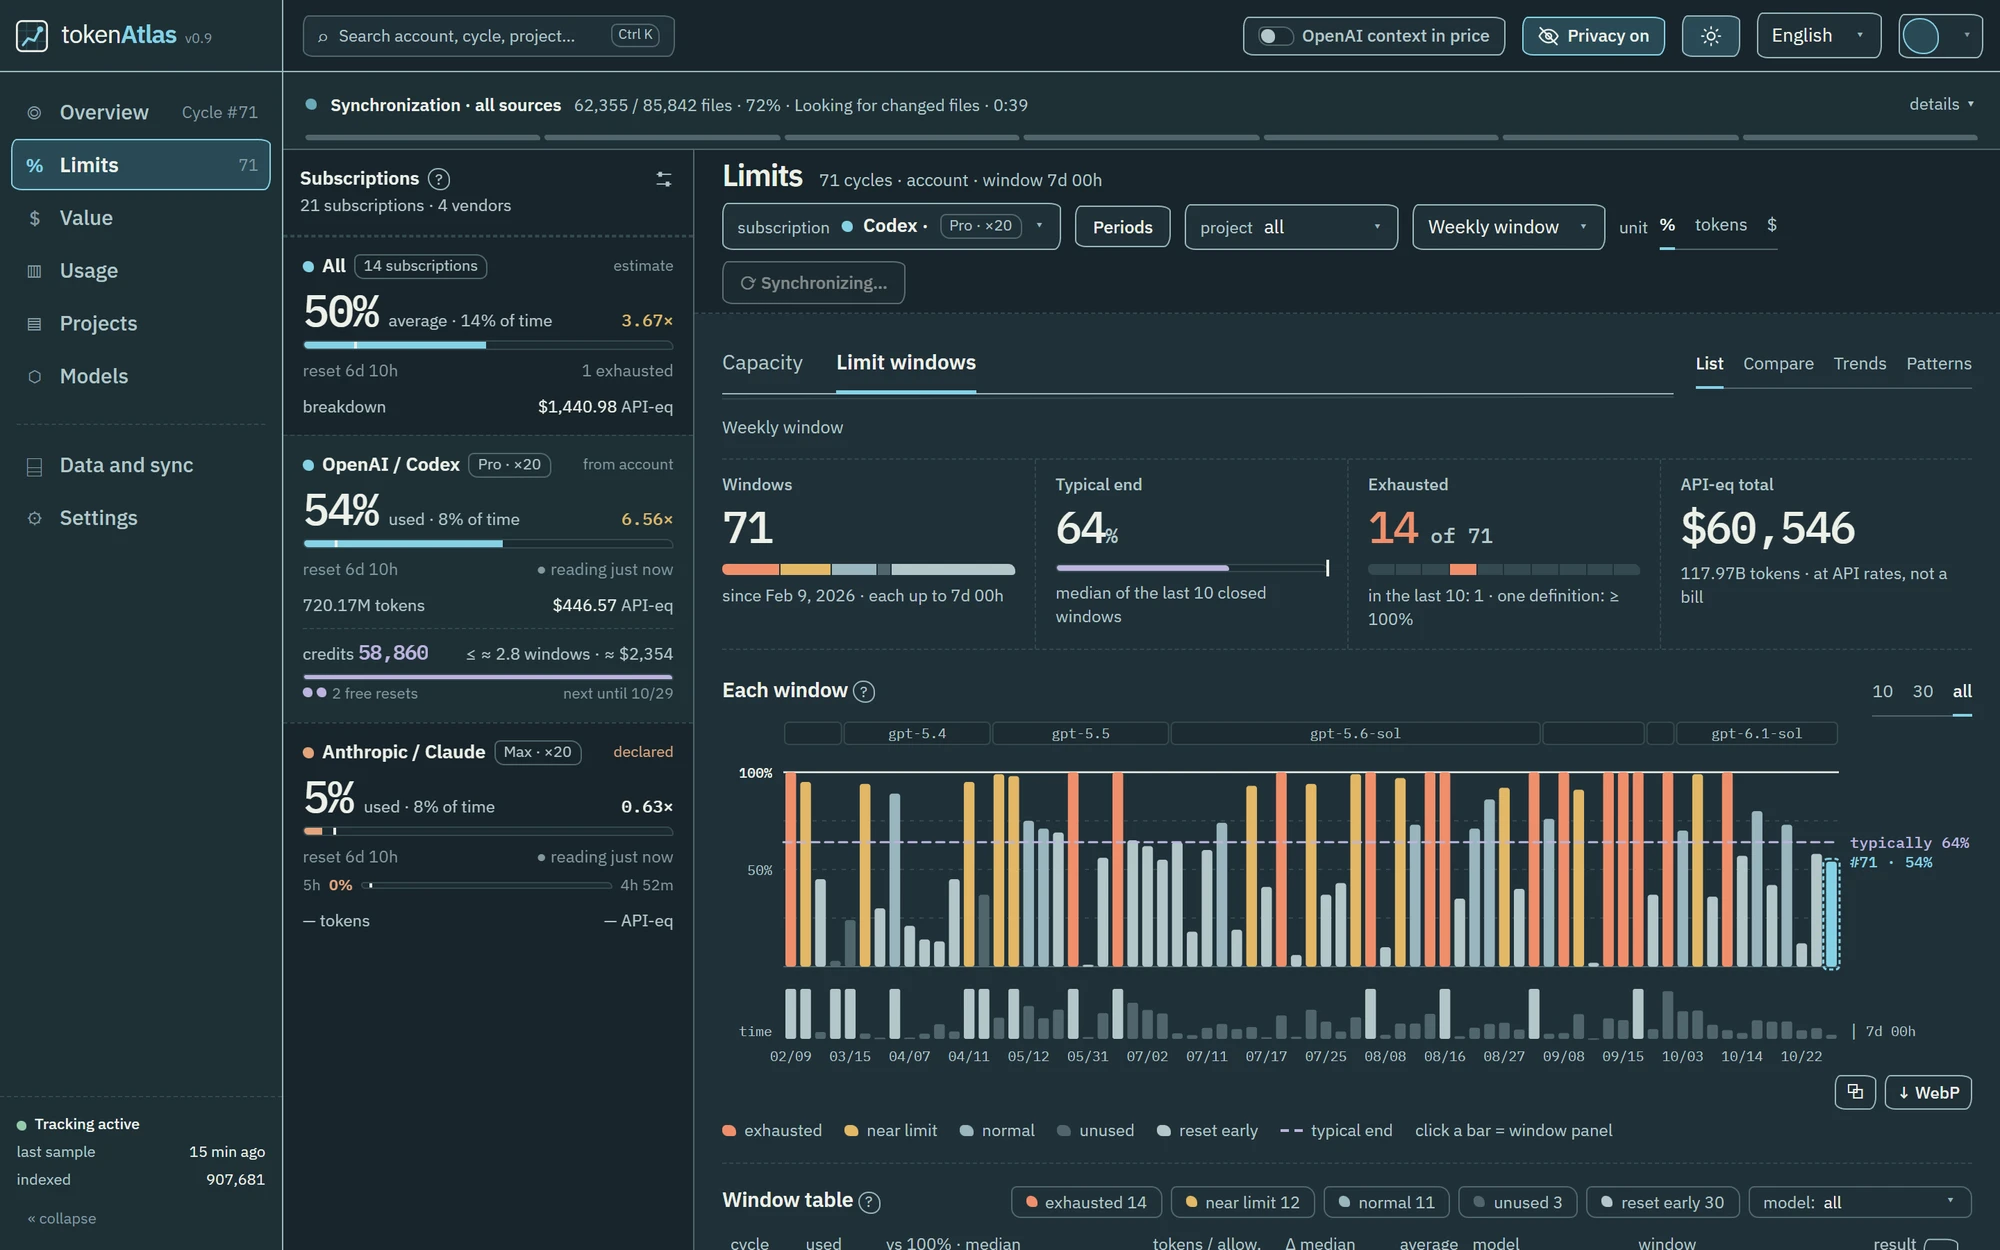
Screenshot of the tokenAtlas Overview: usage, time to reset and pace of the current window, with a chart forecasting when the limit will be reached.Screenshot of the tokenAtlas Overview: usage, time to reset and pace of the current window, with a chart forecasting when the limit will be reached.
Overview: the current window, how fast it is filling and when the limit is forecast to run out.

Also in the app

Each number shows what it is based on. Missing data stays missing.

Your data. On your computer.

tokenAtlas works with local sources and an archive. You decide what to connect and which projects to track.

Read the setup guide

  1. Run it locally

    Get the repository and follow the setup instructions. The app needs only Bun; _dev.bat installs it and the parser when they are missing.

  2. Choose your sources

    Configure your archive, accounts and projects. tokenAtlas collects history from supported tools.

  3. See the full picture

    Check capacity, compare projects and follow changes over time in one place.

Good to know.

Is tokenAtlas finished?

Not yet: tokenAtlas is in beta. It is used every day, but screens, features and calculations still change and errors are possible. Its figures are estimates at API rates, not invoices or proof of what a provider charged or granted. Please report problems on GitHub.

Does tokenAtlas replace AI subscriptions?

No. tokenAtlas helps you analyse usage of tools you already use. It does not sell access to models or increase provider limits.

Is the project cost what I pay on my invoice?

Not always. The subscription fee, a project's share of that fee and the API equivalent are different measures. tokenAtlas lets you analyse them using the available data. The example on this page only shows a sample API equivalent.

Does every integration show remaining limits?

No. History, token counts and current limits depend on what each tool exposes. Some sources provide only part of this data. A missing reading does not mean zero usage.

Does it work across several computers?

Yes. Each machine mirrors its own history into a shared archive and reads the others from it, so the picture is the same wherever you open the app.

Can this website access my data?

No. This is a static product page with sample data. It does not connect to your AI accounts or local tokenAtlas database. It only remembers your language and theme choices in your browser.

Help build tokenAtlas.

I am building a tool for people who want to understand their work with AI. Your support means time for more integrations, checking provider changes and improving the app.

See what your AI does for you.

Open the repository

Contact K_NODE

dev@tokenAtlas.dev

Help build tokenAtlas.

Choose how to support tokenAtlas financially. You confirm any payment on the provider's site.