

Capacity with context.
Check subscription usage, the next reset and past windows. See when you are approaching a limit and when capacity is going unused.
Several tools. Different subscriptions. One picture of what is left and where your AI work goes.
It reads the history your tools already keep, assigns it to projects, and measures it against the limits of the plans you pay for.
At this pace about 52% stays unused at reset.
Work from several computers lands in one shared archive, so every machine shows the same picture.
History, token counts and limit readings vary across integrations.
A monthly fee alone cannot tell you what you get from AI. tokenAtlas connects it to how you actually work.
Explore project costs

Check subscription usage, the next reset and past windows. See when you are approaching a limit and when capacity is going unused.
Compare usage and costs across projects. Find out which models and accounts make up the largest share of your usage.

Compare what you pay for a plan with the API value of the work it carried, and see how much of the capacity you bought went unused.

Today, last week, a full cycle. See how your usage changes and return to recorded data without piecing together logs by hand.
For every project you work on, tokenAtlas shows:

What your plans cost, and what the same work would cost at API prices.

Active hours, calls and tokens, cache included.

When the work happened, and which weeks cost the most.

Each account's share, its cost and its API value.

The models behind the project and their share of the tokens.
| Subscription | Subscription cost | API value | API value ÷ cost |
|---|---|---|---|
| Claude A18.6B tokens | ≥ $69.46 | $8,231.76 | ≤ 119× |
| Codex A7.5B tokens | $73.47 | $4,290.61 | 58× |
| Codex B4.2B tokens | $44.73 | $2,035.74 | 46× |
| Other subscriptions476.4M tokens | ≥ $23.38 | $252.00 | ≤ 11× |
| Model | Share | Share |
|---|---|---|
| claude-opus-5-5 | 45.3% | |
| gpt-6.1-sol | 12.0% | |
| gpt-6-astra | 9.8% | |
| claude-opus-5 | 9.0% | |
| gpt-5.6-sol | 6.6% | |
| Other models (16) | 17.4% |
Share of the project's tokens, cache included, all time.
Subscription cost: dated plan prices, split by the API value of each subscription's work; ≥ marks plans without a recorded price. API value: the same calls at public API rates, cached tokens included. Accounts are shown as letters. Data exported:
A weekly percentage says little on its own. tokenAtlas prices every window at API rates and adds up the billing month: the weeks you pay for, plus the windows resets added.

How many full windows and how much API value one billing month delivered, resets included.

Granted resets you choose when to use count in full. Random automatic ones are shown apart: they arrive unannounced, often with the window half used.
Without early resets $7,662automatic +$3,109(not counted)banked +$982(not counted)other +$868(not counted)
| Month | Plan | Paid | Capacity | Used | Used % | Return | Potential |
|---|---|---|---|---|---|---|---|
| 21.10–21.11 ongoing | Pro ×20 | $208.68 | ≈$8,485 | $4,416 | ≈52% | 21× | ≈41× |
| 16.10–21.10 | Pro ×20 | $36.96 | $2,477 | $1,444 | 58% | 39× | 67× |
| 16.09–16.10 | Pro ×20 | $200.00 | $12,621 | $8,526 | 68% | 43× | 63× |
| 16.08–16.09 | Pro ×20 | $217.96 | $21,457 | $16,751 | 78% | 77× | 98× |
| 10.07–10.08 | Pro ×20 | $134.25 | $31,452 | $19,055 | 61% | 142× | 234× |
| 06.07–10.07 | Pro ×5 | $76.71 | $1,056 | $628 | 59% | 8.2× | 14× |
| 02.07–06.07 | Plus ×1 | $21.35 | $124 | $72 | 58% | 3.4× | 5.8× |
| 04.06–16.06 | Pro ×5 | $0.00 | $1,072 | $853 | 80% | — | — |
| 04.05–04.06 | Pro ×5 | $97.89 | $6,894 | $5,326 | 77% | 54× | 70× |
| 27.04–04.05 | Plus ×1 | $4.77 | $175 | $128 | 73% | 27× | 37× |
≈ ongoing month: an estimate for the whole month, the windows to date plus the scheduled windows to its end, without future resets.
Without early resets $16,914automatic +$0(not counted)banked +$0(not counted)other +$1,058(not counted)
| Month | Plan | Paid | Capacity | Used | Used % | Return | Potential |
|---|---|---|---|---|---|---|---|
| 24.10–24.11 ongoing | Max ×20 | $200.00 | ≈$12,570 | $1,464 | ≈12% | 7.3× | ≈63× |
| 24.10–24.10 | Pro ×1 | $0.04 | $566 | $40 | 7% | 1,000× | 14,150× |
| 24.09–24.10 | Max ×20 | $129.91 | $17,972 | $13,680 | 76% | 105× | 138× |
| 12.09–24.09 | Max ×5 | $77.77 | $3,900 | $1,498 | 38% | 19× | 50× |
| 09.09–12.09 | Pro ×1 | $18.75 | $405 | $50 | 12% | 2.7× | 22× |
| 03.08–03.09 | Max ×20 | $207.43 | $2,729 | $2,958 | 108% | 14× | 13× |
| 03.07–03.08 | Max ×20 | $186.26 | $229 | $0 | 0% | 0× | 1.2× |
| 09.06–18.06 | Max ×20 | $207.14 | $1,150 | $1,474 | 128% | 7.1× | 5.6× |
≈ ongoing month: an estimate for the whole month, the windows to date plus the scheduled windows to its end, without future resets.
Sample data. Values are API equivalents, not charges. The value of 1% moves with the models and caching each window used.
tokenAtlas prices each full window at API rates and scales it to 100%, so weeks of different plans and periods line up:
The capacity of each window from reset to reset, scaled to 100%, as one segment per cycle.

Marked moments show the levels a full week went through, from its highest to today.
Each cycle with its dates and its value at 100%, no extra columns.
The provider's announcements and global resets, dated between the cycles as in the app.

History entries share one timeline with the cycles, so next to an event you see what capacity did afterwards. For example: 09-29 · Pro $200: 20× → 10× usage announced, and from 10-03 a full week went from $1,425 to $1,116 (−22%).
Real cycles, anonymised. Values are API equivalents scaled to 100% of the window, not charges.
Attach measured windows to each plan and compare them tier by tier: the median full week at API rates, and what each dollar of the subscription buys.
Codex and Claude plans side by side at ×1, ×5 and ×20.
The median value of each plan's full weekly window over the history you choose.
API value per dollar of the subscription, so different prices compare fairly.
Switch between 30, 90 and 360 days; a plan without windows in that period stays empty and says when it was last measured.
Codex and Claude plans tier by tier · each plan shows its cycles from the chosen history
| Tier | Codex | Claude | Lead · API $ |
|---|---|---|---|
| ×1 | Plus ×1$20 / mo $53.1811.56× per $1 | Pro ×1$20 / mo no estimate | needs both sides |
| ×5 | Pro ×5$100 / mo no estimate | Max ×5$100 / mo no estimate | needs both sides |
| ×20 | Pro ×20$200 / mo $1187.3925.82× per $1 | Max ×20$200 / mo $2596.2956.45× per $1 | lower bounds · no winner |
| Tier | Codex | Claude | Lead · API $ |
|---|---|---|---|
| ×1 | Plus ×1$20 / mo $59.3912.91× per $1 | Pro ×1$20 / mo $640.58139.27× per $1 | lower bounds · no winner |
| ×5 | Pro ×5$100 / mo no estimate | Max ×5$100 / mo $406.1317.66× per $1 | needs both sides |
| ×20 | Pro ×20$200 / mo $1281.5327.86× per $1 | Max ×20$200 / mo $2536.1955.14× per $1 | lower bounds · no winner |
| Tier | Codex | Claude | Lead · API $ |
|---|---|---|---|
| ×1 | Plus ×1$20 / mo $8618.7× per $1 | Pro ×1$20 / mo $640.5139.25× per $1 | lower bounds · no winner |
| ×5 | Pro ×5$100 / mo $55324.05× per $1 | Max ×5$100 / mo $40617.65× per $1 | Codex +36% |
| ×20 | Pro ×20$200 / mo $139530.33× per $1 | Max ×20$200 / mo $253655.14× per $1 | lower bounds · no winner |
Sample data, not a benchmark of either provider. In the app you attach windows from your own accounts; a plan without them stays empty, or is derived from another tier only when you ask.
tokenAtlas sets the current window beside the latest closed windows of the same plan, at the same moment of their course:
Usage since the window started, up to now.
The four newest closed windows of the same plan, drawn alongside.
Where a usual window would be by now, and where this one is heading.
A table that sets every window side by side at the same point of its course.
○ = end of the window. Grey = another plan, left out of the typical course. ┅ = forecast of the current window.
Building history: 1/2 closed windows with the same plan and cadence.
| window | usage after ● end · ┃ now 47% | then | end | Δ to now |
|---|---|---|---|---|
| current 2026-10-25T11:00:00.000Z | 47% | — | — | |
| 10-18 | no coverage | 100% | — | |
| 10-24 other plan · Pro ×1 | no coverage | 14% | — | |
| 10-11 | 86% | 97% | −39.0 pp | |
| 10-08 other cadence | 31% | 100% | +16.1 pp |
Sample data. Point at any moment of the window to compare it.
tokenAtlas times every response it can and turns it into output tokens per second, model by model:
Output tokens per second, day by day, for each model you used.
Speed is read from long responses, where the wait for the first token no longer hides the real pace.
A provider's declared speed and the day it was announced, on the same chart.
Seven days before the announcement against seven days after, with the change in percent.
Long answers · output tokens per second, per day
| Model | 7 days before | 7 days after | Change |
|---|---|---|---|
| gpt-6.1-sol | 19.6 | 27.4 | +40% |
| gpt-6-luna | 44.6 | 79.0 | +77% |
| gpt-6-astra | 26.7 | 36.1 | +35% |
| gpt-6-sol | 31.2 | 64.3 | +106% |
Public measurements from the author's accounts, as of 2026-10-29.
tokenAtlas indexes everything your AI tools have already done into one local store. Each screen asks it a different question.

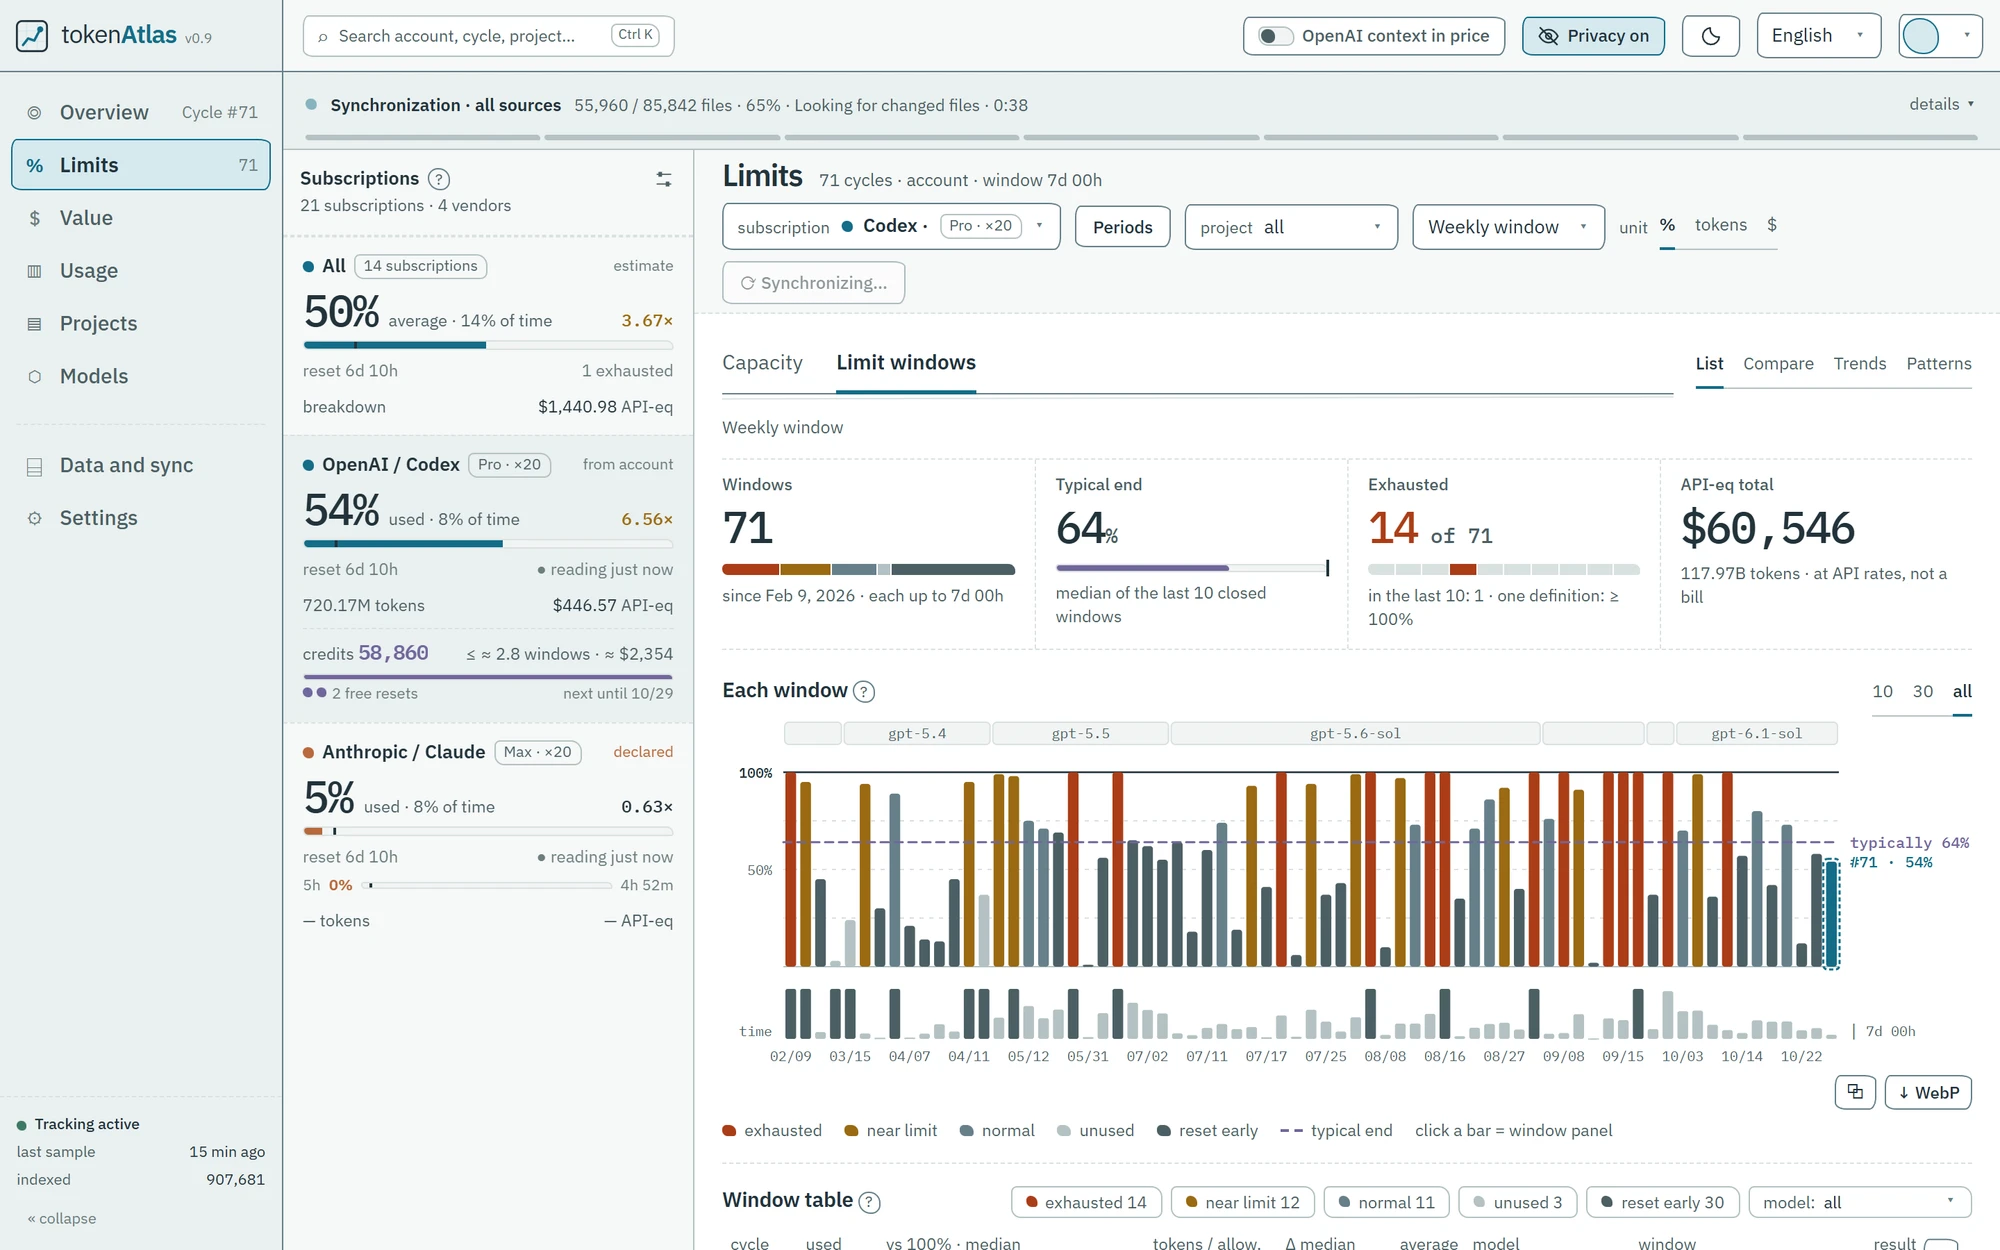
How much of the limit is gone against how much of the cycle is gone, and what that implies.
Every window as a bar and a table row: how it ended, how long it ran and which model led.
Output tokens per second for each model, from sending the request to the end of the response.
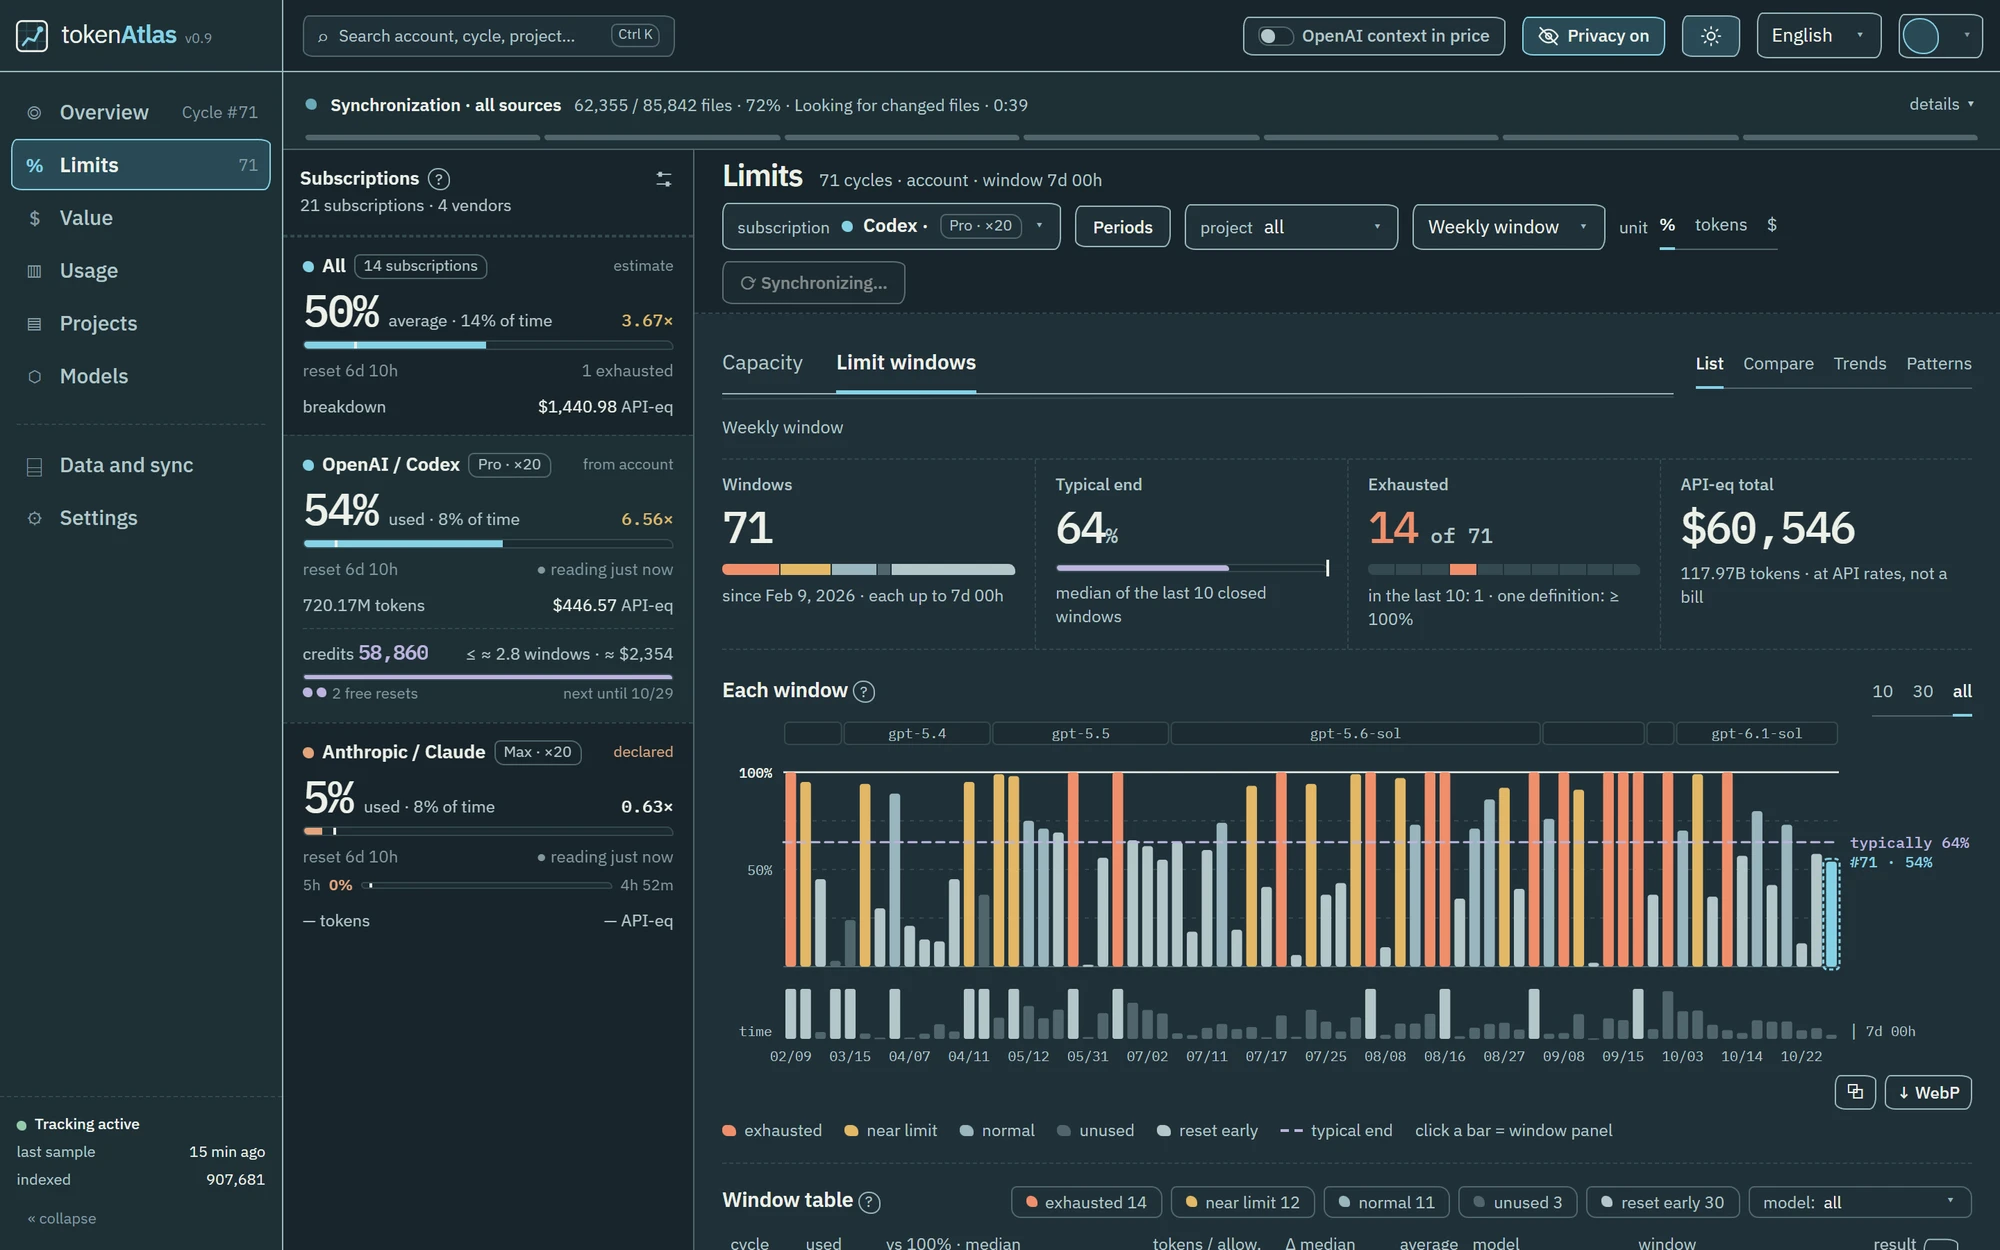
Real screens from the app, running on the author's own history. Account names are hidden by the app's privacy mode.


Tokens, API equivalent and calls from every source, by day, week or month, split by provider or model.
What 1% and a full window are worth, compared with similar cycles and across subscriptions.

The current window against recent windows of the same plan and their median course, at the same moment.

Usage per window and the estimated full allowance; its Patterns tab shows the typical window course, working hours and anomalies.

Consumption by model and by surface: editor, terminal or delegated run.

Individual API calls, the bottom of every drill-down.

Usage per project, the rules that assign work to projects, and what is still unassigned.
Computers and profiles, dated account periods, plans, prices and model rates.

Synchronization of each provider, the age of the data and the checks run on it.
Each number shows what it is based on. Missing data stays missing.
tokenAtlas works with local sources and an archive. You decide what to connect and which projects to track.
Read the setup guide
Get the repository and follow the setup instructions. The app needs only Bun; _dev.bat installs it and the parser when they are missing.
Configure your archive, accounts and projects. tokenAtlas collects history from supported tools.
Check capacity, compare projects and follow changes over time in one place.

Not yet: tokenAtlas is in beta. It is used every day, but screens, features and calculations still change and errors are possible. Its figures are estimates at API rates, not invoices or proof of what a provider charged or granted. Please report problems on GitHub.
No. tokenAtlas helps you analyse usage of tools you already use. It does not sell access to models or increase provider limits.
Not always. The subscription fee, a project's share of that fee and the API equivalent are different measures. tokenAtlas lets you analyse them using the available data. The example on this page only shows a sample API equivalent.
No. History, token counts and current limits depend on what each tool exposes. Some sources provide only part of this data. A missing reading does not mean zero usage.
Yes. Each machine mirrors its own history into a shared archive and reads the others from it, so the picture is the same wherever you open the app.
No. This is a static product page with sample data. It does not connect to your AI accounts or local tokenAtlas database. It only remembers your language and theme choices in your browser.
I am building a tool for people who want to understand their work with AI. Your support means time for more integrations, checking provider changes and improving the app.
I also run moVear — a watch strap and accessories brand. Buying something for yourself or as a gift also supports my work on tokenAtlas.
Visit moVear